Prospect Research · Large
Closing Time: Calculating Risk to Encourage Proposal Velocity
By Ashley Mick and Alex Calvin | January 26, 2024
Many organizations face the challenge of maximizing major gift donations with small teams or limited resources. One possible solution is to leverage the expertise of the prospect development (PD) team. By working closely with the information and technology services (ITS) team, PD can analyze historical data to pinpoint high- risk proposals, facilitate the progression of proposals through the pipeline and support frontline fundraisers. This article delves into a collaborative initiative between prospect development and information and technology services to enhance our organization's fundraising efforts.
The Question
Every successful project begins with a question. In our case, we asked, "How long does it take to ask or close a proposal within our organization? Given a finite number of donors and fundraisers, how can we raise more money more quickly?" As we worked on creating reports to address these questions, we identified key measures to assess the overall efficacy of a proposal. Our aim was to measure the impact of effective outreach in advancing proposals and establish guidelines for maximizing the success of fundraising efforts.
Research
Proposal velocity is the measure of outreach to a donor and change to proposal status within a specific period. ITS pulled historical proposal information that gave insight into how long proposals stayed in cultivation or solicitation, how much outreach donors received in both stages and what kind of outreach. Assessing velocity allows us to estimate the time and effort required for our frontline fundraisers to advance to the next stage, as well as identify potential risks of rejection or withdrawal. We carefully evaluated each proposal based on specific criteria to ensure accurate results, excluding any outliers to avoid skewing the data.
Benchmarking
After conducting our initial benchmarking, we gained valuable insights into our proposals.
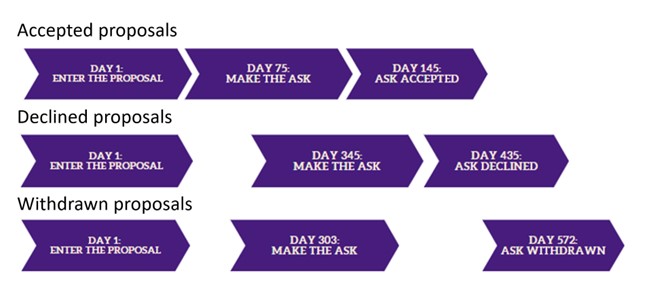
Figure 1: Proposal Benchmarking Rates

Consistent and timely cultivation and solicitation increased the likelihood of proposal acceptance. On the other hand, declined proposals had a notably longer overall timeline, with a significant gap between the initial submission and the ask date. Additionally, we observed withdrawn proposals followed a similar timeline to declined ones, but with irregular and widely spaced intervals between stages.
Based on the information provided, our PD team offers the following recommendations for major gifts (i.e. gifts above $25,000 and under $1,000,000):
- Cultivation: we recommend development officers (DOs) execute one meaningful move every six weeks, inclusive of a visit roughly every eight weeks, before a solicitation is made.
- Solicitation: we recommend DOs execute one meaningful move every three weeks, inclusive of a visit roughly every eight weeks, after a solicitation is made.
- Proposal age: consider withdrawing a proposal that has been active for more than 14 months.
Implementation and 5 Measures of Velocity Risk
With these benchmarks identified, the PD team created a scoring system to assess risk based on five measures of proposal age and fundraiser activity. Each proposal is assigned a score to identify which ones are progressing normally and which need further discussion. Additionally, assessing a velocity risk score helps determine the optimal duration for a proposal to remain in the system and the best frequency for reaching out to the donor. These insights help prospect development team members engage in discussions with frontline fundraisers.
- Age in stage: the number of days a proposal has been in cultivation or solicitation.
- Meaningful move age: the number of days elapsed since the last meaningful outreach to a donor.
- Visit age: the number of days elapsed since the last visit made to a donor.
- Meaningful moves in stage ratio: the number of meaningful moves made in cultivation or solicitation compared to the expected number of moves based on PD recommendations.
- Visits in stage ratio: the number of visits made in cultivation or solicitation compared to the expected number of moves based on PD recommendations.
Each measure is given a score from 1-3, based on how far it deviates from the expected value. A score of 1 means that the measure is on track and is low risk, while a score of 2 means it's falling behind and poses a medium risk. A score of 3 means it's behind and poses a high risk.
We sum each measure together to provide an overall velocity score. We then apply a different scoring to the proposal, determined by its type. For industry engagement proposals, corporate record types and planned proposals with a target close date more than 12 months away, visit age and visits in stage are excluded from the calculation. The sum of the remaining three measures produces a three-factor risk score, with a threshold ranging from three (low risk) to 9 (high risk). For all other proposals, we use the full five-factor risk score, which ranges from five (low risk) to 15 (high risk).
Visualizing Proposal Risk
With calculations determined, ITS took the lead in presenting the data we had been reporting in a convenient and usable manner. We chose to utilize the data set as a foundation for a Power BI dashboard to leverage the advantages of data visualization. Visualizing data simplifies complex information and improves its accessibility to a broader audience. Our PD team utilizes visualized proposal velocity data to pinpoint proposals needing further planning, enabling them to prioritize discussions with frontline fundraisers. Visual elements such as scatterplots and tables provide an incredibly intuitive method for representing data, facilitating the ease of working with proposal data for our teams.
Tips for Effective Data Visualization
- Understand the audience: Understand your audience and their needs. Connect with them to identify important data points and determine the best presentation methods. This ensures that your report is clear and well received. We created a user-friendly dashboard for the prospect development team, ITS team and DOs, offering simplicity for general understanding and depth for advanced data exploration.
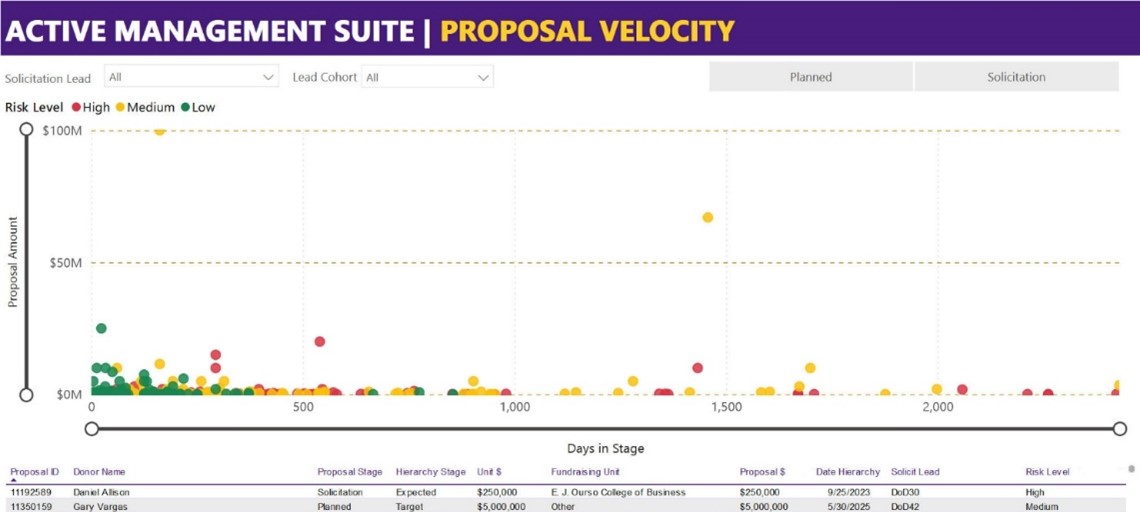
- Choose the right visualizations: Selecting appropriate visualizations is crucial to effectively telling your story. Visualizations can help convey your message, and it's essential to choose the right ones that align with your desired narrative. For our data visualizations, we used a scatterplot for its comprehensive view and intuitive interaction, aiding users in assessing portfolio health. Additionally, we integrated a data table for added context, enhancing the scatterplot's insights with accessible, detailed information.
- Use color: Colors can effectively draw attention to important data points and information. However, keep your palette simple to avoid confusion and improve readability. We employed a red-yellow-green color gradient in the visualization to intuitively indicate the health of a proposal, ensuring immediate comprehension with minimal need for explanation.
- Make it accessible and interactive: Define terms and use clear labels for data. Add interactive features like filters, sliders, drill-downs, etc., for audience exploration. We ensured accessibility by providing essential filters upfront for easy use while offering comprehensive data filtering options in a sidebar, catering to users' varied exploration needs.
- Keep it simple: Data visualization is about telling a story. Keep it simple with a clear focus to create effective visualizations. We maintained visual simplicity and clarity in the dashboard, ensuring every accessible element was meaningful and contributed effectively to the narrative for all users.
Figure 2: An Example of Data Visualization*

We have demonstrated the importance of proposal velocity and its impact on creating actionable strategies to effectively cultivate proposals. Our collaborative approach, bringing together the prospect development team's expertise with ITS, confirms the importance of adopting a data-driven approach to make decisions, developing new ideas and concepts and sharing the outcomes with a wider audience. We encourage all teams to embrace this paradigm and utilize innovative data strategies to enhance their outcomes in fundraising. To summarize, our venture into the world of data has confirmed that making informed decisions based on data is fundamental to maximizing our major gift fundraising potential successfully.
* Editor’s note: the data present in Figure 2 uses randomized, fake personal identifying information and is to exemplify data visualization only.

Ashley Mick
Director of Prospect Management, LSU Foundation
Ashley Mick is Director of Prospect Management for the LSU Foundation. In this role, she provides strategic and data-driven support to frontline fundraisers via strategy support, productivity analytics, and pipeline management. She can be reached at amick@lsufoundation.org or on LinkedIn.
Alex Calvin
Application Developer, LSU Foundation
Alex Calvin is a skilled software developer with a deep understanding of programming and a passion for solving complex problems. Throughout his career, he has successfully taken on diverse projects, tackling unique challenges and adapting to various technical needs. Proficient in languages such as C#, Python, Dynamic HTML and SQL, Calvin seamlessly adapts to the organization's technological requirements. With a strong focus on user-centric design, he creates elegant solutions that prioritize intuitive functionality and exceptional user experiences. Personable and driven to innovate, Calvin believes in placing the user at the heart of the development process.