Data Science
The Check Your Donor Score Has Probably Never Had
By Shivam Lalakiya | November 03, 2026
Most donor scores are checked in a way that quietly lets them peek at the future. Before I measured how much that matters, I wrote down a prediction: I expected it to make scores look slightly better than they really are. A footnote-sized effect.
The effect came out four to five times larger than the top of my guess. The same model, scoring the same donors, looked strong when checked one way and barely better than a coin flip when checked the other. The only difference was the date the model’s inputs were calculated from: the date the score claimed to predict from, or today.
The Shortcut
To check a score properly, you pretend it is an earlier date, score everyone using only what you knew on that date then see what those people actually did next.
The shortcut is to build the inputs for that check from today’s database instead of the database as it stood on the earlier date. Take lifetime giving. If you calculate it today and use it to grade a score “as of” two years ago, it includes every gift made in the two years since, including the very gifts the score is supposed to be predicting. Information from the future has leaked into the check. The score is being graded on an exam it has already seen the answers to.
The same leak happens with:
- Last gift date, largest gift and gift counts
- Screening or capacity ratings appended after the earlier date
- Event attendance, volunteer flags and household links
- Gift officer ratings and stage codes, which change once contact begins (and contact usually begins because the person already looked promising)
- Donors added to the database after the earlier date, who could not have been scored then
Why Nobody Catches It
Analysts hunt down mistakes that make results look worse, because a disappointing number invites a second look. This mistake makes results look better, so nobody goes looking. The cost shows up a year later, when gift officers have spent their time on a portfolio the score promised would convert, and it doesn’t.
What I Measured
To see how big the leak can get, I used a public data set from the KDD Cup 1998 competition: the direct-mail file of a national veteran’s organization, covering 95,412 donors across 22 mailings. The model was deliberately bare, with three inputs: total given so far, number of gifts so far and the amount given in the most recent mailing. For each mailing, it predicted who would give in the next one.
I checked the model twice, and the two checks were identical except for one thing. In the first, the as-of check, every input used only records dated on or before the scoring date. In the second, the shortcut check, the two running totals were calculated from the whole file, future gifts included.
Here is what that looked like for one mailing. Of the 95,412 donors on file, 242 gave (donors who weren’t mailed count as not giving). A score that picked people at random would find about 24 of them in any 10% slice of the file. In the as-of check, the model’s top 10% held 47, about twice as many as random: modest, but real. In the shortcut check, its top 10% appeared to hold about 130, more than half of all the givers. A second standard measure, AUC (area under the curve: the chance that the model ranks a random giver above a random non-giver), rose from 0.53 to 0.85. On that scale, a coin flip scores 0.50 and a perfect score is 1.0.
The chart below shows the same comparison for all three mailings I checked. The first of those had only nine givers, so its dip below the coin-flip line is noise.
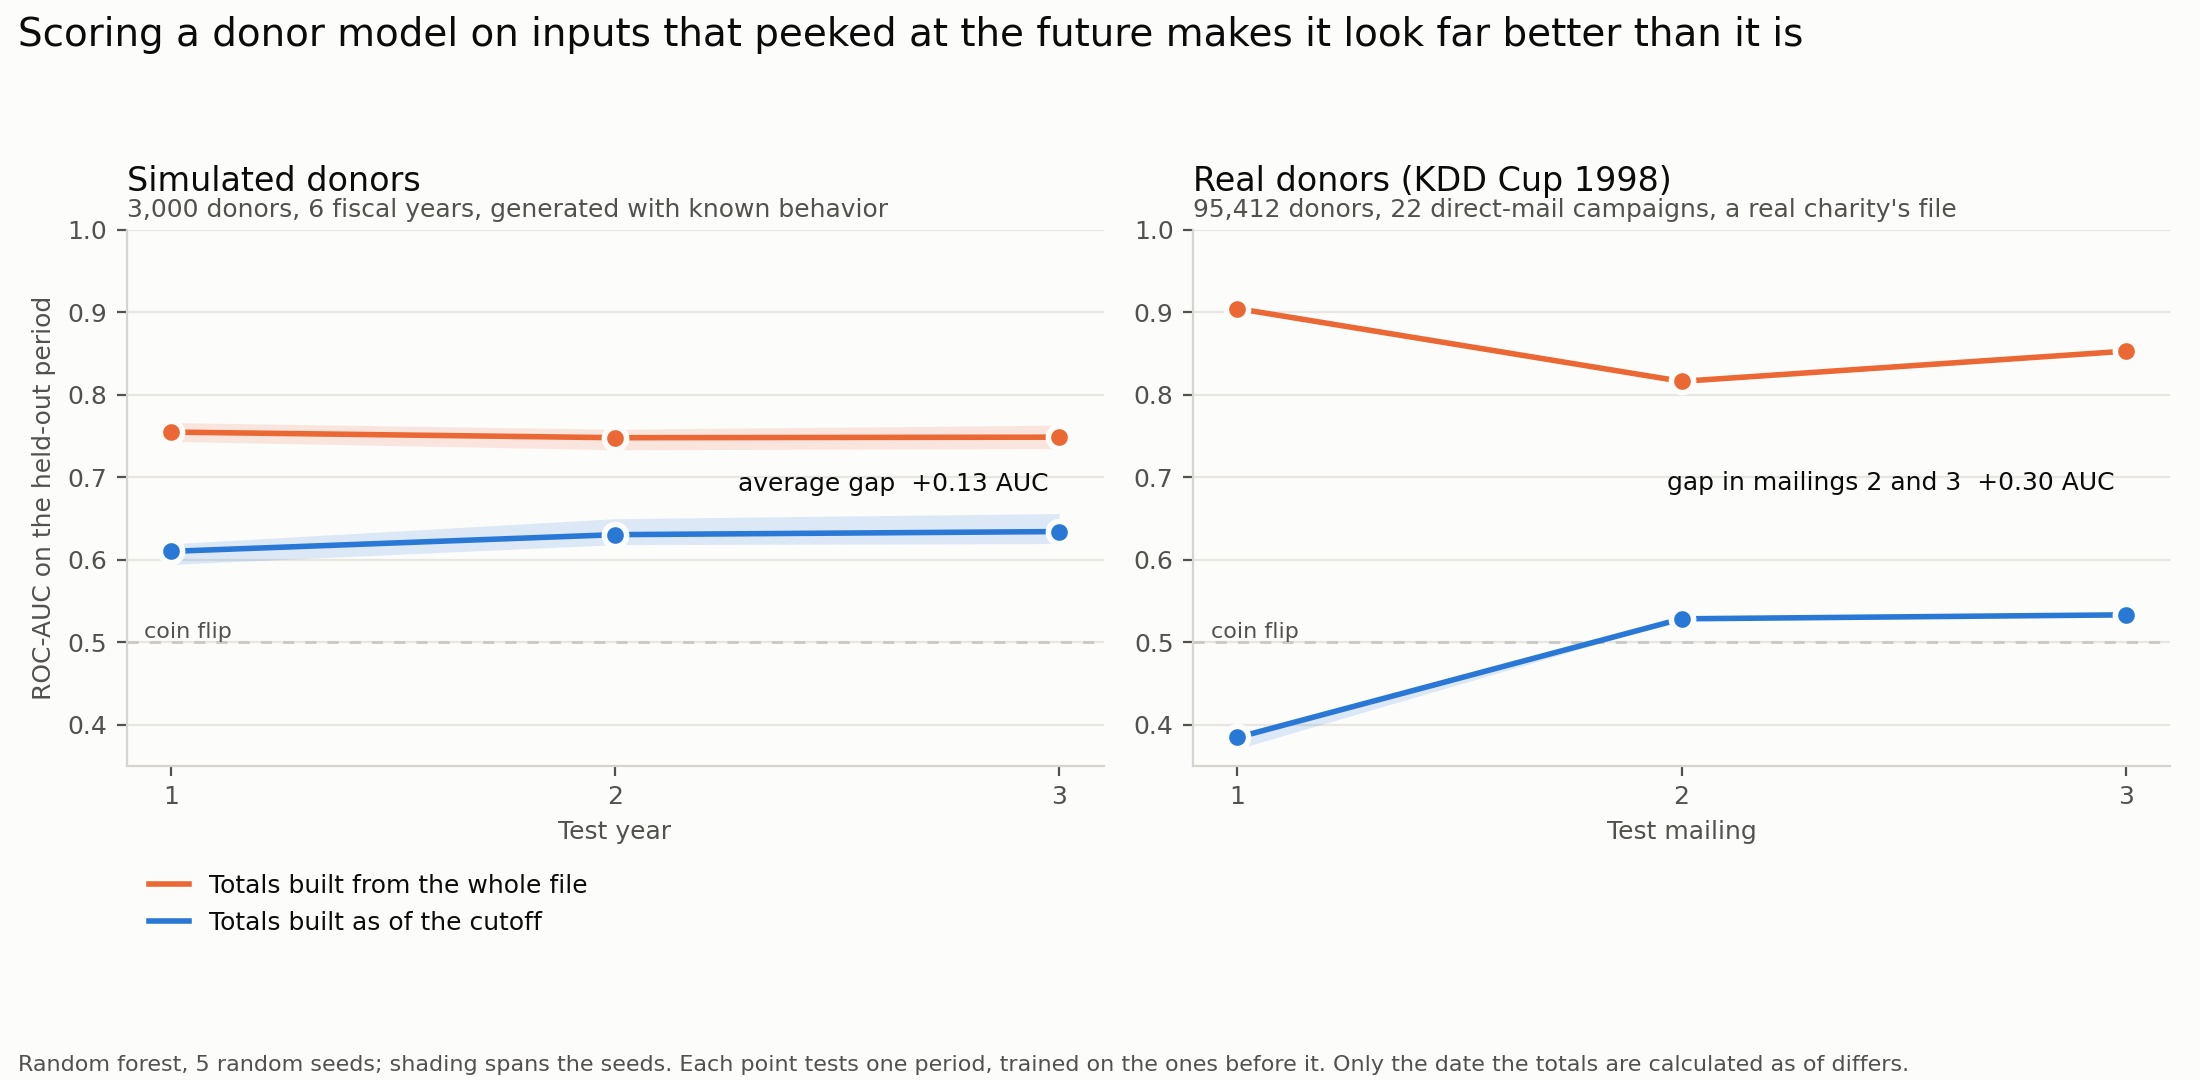
Two cautions. First, the model’s as-of score is weak because it uses only three inputs, not because donor scoring doesn’t work. What matters here is the gap between the two checks of the same model. Second, the leak in my check was severe: those two totals saw the entire future, including the very gift being predicted. In a real shop the leak is usually partial, maybe one lifetime total or one freshly appended screening field, so your gap is probably smaller. But you can’t tell how big it is from a score’s headline accuracy alone, and that is the problem.
The Check
You can run this check on any score, whether it was built in-house or bought from a vendor. All you need is a CRM query plus a spreadsheet, SQL or a script. The idea is to check the score twice, once the as-of way and once the shortcut way, and compare the results.
-
Pick a cutoff date at least 12 months ago and write it down. This is the “earlier date” you will pretend it is. For a vendor score or a saved snapshot, the score must have been built on or before the cutoff; otherwise it has already seen part of the year you are grading. That means a score less than a year old can’t be checked this way yet.
-
Rebuild every input as of the cutoff. Use only records dated on or before it: gifts by gift date, events by event date, contact reports by contact date. For screening data, use the file you had at the time, or leave the field out. Drop anyone added to the database after the cutoff. Treat any undated field as a suspect and note it. This is the step almost everyone skips.
-
Score the rebuilt table. For an in-house model, retrain it using only history from before the cutoff. For a vendor score, ask the vendor to run the version they had at the cutoff on the table you rebuilt in step 2. If your CRM keeps old score snapshots, use the most recent one dated on or before the cutoff.
-
Pull what happened next. For the same people, record what they did in the 12 months after the cutoff, using the outcome the score claims to predict: whether they gave, gave above a set amount or moved to a major gift.
-
Score it again the shortcut way. Repeat step 3 for the same people, but with inputs pulled from today’s database (for a saved snapshot, use today’s score). Then compare the two versions: for each, sort by score, take the top 10% and divide their outcome rate by the rate for everyone in the file. That ratio tells you how many times better than random the score is.
If the two ratios are close, nothing leaked, and the as-of ratio tells you how well the score really works. If the shortcut version looks much better, something leaked. To find it, swap one input at a time back to its as-of value and rerun. The input that closes the gap is your leak.
The Habit That Prevents It
The fix isn’t software. It’s a rule: every input to a score carries the date it was calculated as of, and every check of a score uses only inputs dated before the period it is predicting. A score that has never been checked that way hasn’t really been checked yet.
Reference
Hettich, S., & Bay, S. D. (1999). The UCI KDD Archive [KDD Cup 1998 data]. Irvine, CA: University of California, Department of Information and Computer Science. https://kdd.ics.uci.edu/databases/kddcup98/kddcup98.html

Shivam Lalakiya
Data Analyst, Washington University in St. Louis
Shivam Lalakiya is a Data Analyst at Washington University in St. Louis. The methodology behind this article is documented here.